
The sigma value is a statistical term that is explained in the following bell-shape curve.
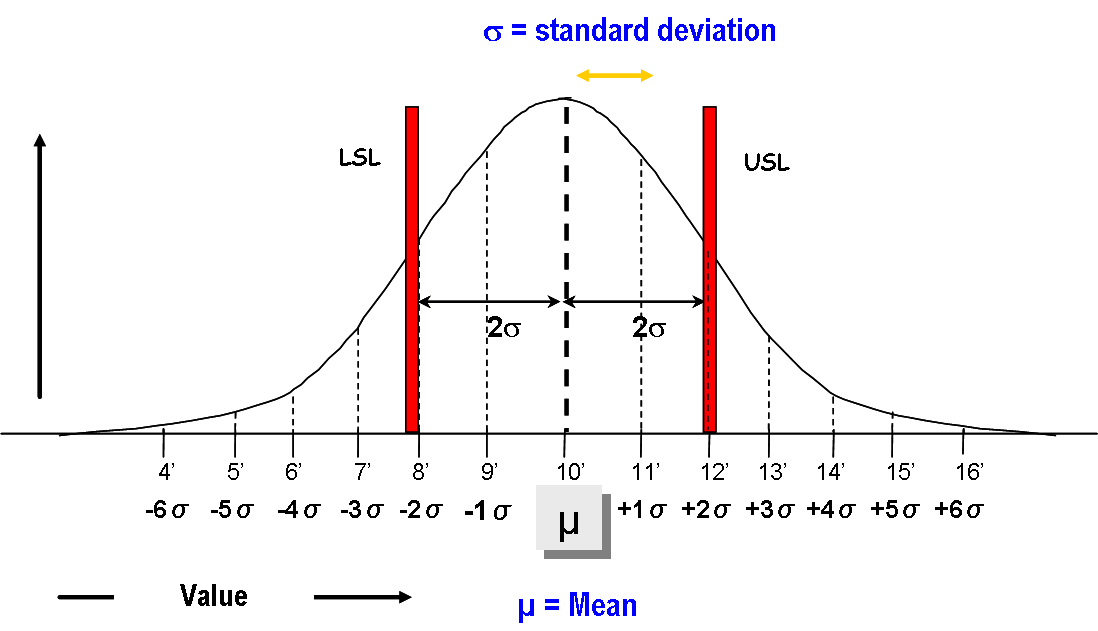
The curve shown above is Normal Distribution. The curve is characterized by two variables: µ (mean) and σ (standard deviation.
The above curve shows the results (Values) for the number of days between the send date and the arrival date of a package.
The height of the line indicates the number of times that the package duration was at the duration of the value. The target duration for the packages is specified as between 8 days (LSL - Lower Specification Limit) and 12 days (USL - Upper Specification Limit). When many packages are send for this target a Normal Distribution with a Mean duration of 10 days is established.
Duration outside the LSL and USL are failures; the durations between the LSL and USL are correct. The Mean value is defined as the sum of all values divided by the number of values. The standard deviation is defined as the average distance between the values and the LSL / USL. The more durations are inside the curve and the steeper the curve will be. The steeper the curve, the more standard deviations fit inside the LSL and USL and the better the process is performing. In this exapmle 2 sigmas fit between Mean and LSL / USL. This is defined as a 2σ process. In this process 69.1% of the packages are delivered correct.
With a six sigma project the process can be improved. a 6σ process is defined as a high quality process. In a 6σ process 99.9996% of the packages are delivered correct. The next table shows the relation between sigma values, Defects Per Million Opportunities and correct items (Yield).
| Sigma | DPMO | Yield |
| 2 | 308,537 | 69.1% |
| 3 | 66,807 | 93.3% |
| 4 | 6,210 | 99.37% |
| 5 | 233 | 99.976% |
| 6 | 3.4 | 99.9996% |